In the case of a higher frequency carrier onto which lower frequency information is modulated, it is necessary to translate the information content down to a frequency band low enough for the A-to-D converter (ADC) to use. Modern (as of 2006) ADCs easily operate at sample rates beyond 100 MHz while delivering 12 to 14 bits or more of resolution. That is a phenomenal achievement considering that a mere 15 years ago radar design teams I worked on were struggling to do 10-12 bits at 20 MHz using custom-designed circuits. If you had an ADC running at 216 MHz, it would be possible to directly sample the FM radio band signal (88 - 108 MHz) and demodulate the information in software. We're not quite there yet, so it is still necessary to use and RF mixer to downconvert the RF to a baseband frequency that can be used. AM radio (520 – 1,610 kHz) could, though, be directly sampled at RF.
There is another option called undersampling (sometimes called bandpass sampling, or super-Nyquist sampling) whereby the aliasing phenomenon is exploited to enable the ADC to sample the signal using a rate that intentionally aliases the modulated carrier (fCARRIER) into the operating range of the ADC. Determining the necessary sampling frequency (fSAMPLE), is a fairly simple 2-step process that uses the following two formulas:
(eq. 1)  (eq. 2)
(eq. 2) As an example, consider a 20 MHz signal modulated on a 2 GHz carrier. Per the Nyquist sampling theorem, a clock rate of at least 4.04 GHz (2 x 2.02 GHz) would be needed to directly sample this signal. Now, working through the above equations, we first solve equation 1 for the minimum sampling frequency:

Next, plug that value into equation 2 to calculate Z, and round the answer down to the nearest integer value:

Finally, use the final value of Z to calculate the Undersampling frequency:

補充說明1:
Undersampling
In signal processing, undersampling or bandpass sampling is a technique where one samples a bandpass filtered signal at a sample rate below the usual Nyquist rate (twice the baseband bandwidth, i.e. twice the upper cut-off frequency), but is still able to reconstruct the signal.
When one samples a bandpass signal, the samples are equal to samples of a low-frequency alias of the high-frequency signal. Such undersampling is also known as bandpass sampling, harmonic sampling, IF sampling, and direct IF-to-digital conversion.[1]
Description
Real-valued signals have Fourier spectra with symmetry about zero. That is, they have a negative-frequency spectrum that is a mirror image of the positive-frequency spectrum. Sampling effectively shifts both sides of the spectrum by multiples of the sampling frequency. The criterion to avoid aliasing is that none of these shifted copies of the spectrum overlap.
In the case of the bandpass (non-baseband) signals, with low and high band limits fL and fH respectively, the condition for an acceptable sample rate is that shifts of the bands from fL to fH and from –fH to –fL must not overlap when shifted by all integer multiples of sampling rate fs. This condition reduces to the constraint:[2][3]
 , for some n satisfying:
Important signals of this sort include a radio's intermediate-frequency (IF) or radio-frequency (RF) signal.
If n > 1, then the conditions result in what is sometimes referred to as undersampling, bandpass sampling, or using a sampling rate less than the Nyquist rate 2fH obtained from the upper bound of the spectrum. See aliasing for a simpler formulation of this Nyquist criterion that specifies the lower bound on sampling rate (but is incomplete because it does not specify the gaps above that bound, in which aliasing will occur). Alternatively, for the case of a given sampling frequency, simpler formulae for the constraints on the signal's spectral band are given below.Example: Consider FM radio to illustrate the idea of undersampling.
- In the US, FM radio operates on the frequency band from fL = 88 MHz to fH = 108 MHz. The bandwidth is given by

- The sampling conditions are satisfied for

- Therefore, n can be 1, 2, 3, 4, or 5.
- The value n = 5 gives the lowest sampling frequencies interval
 and this is a scenario of undersampling. In this case, the signal spectrum fits between 2 and 2.5 times the sampling rate (higher than 86.4–88 MHz but lower than 108–110 MHz).
- A lower value of n will also lead to a useful sampling rate. For example, using n = 4, the FM band spectrum fits easily between 1.5 and 2.0 times the sampling rate, for a sampling rate near 56 MHz (multiples of the Nyquist frequency being 28, 56, 84, 112, etc.). See the illustrations at the right.
- When undersampling a real-world signal, the sampling circuit must be fast enough to capture the highest signal frequency of interest. Theoretically, each sample should be taken during an infinitesimally short interval, but this is not practically feasible. Instead, the sampling of the signal should be made in a short enough interval that it can represent the instantaneous value of the signal with the highest frequency. This means that in the FM radio example above, the sampling circuit must be able to capture a signal with a frequency of 108 MHz, not 43.2 MHz. Thus, the sampling frequency may be only a little bit greater than 43.2 MHz, but the input bandwidth of the system must be at least 108 MHz. Similarly, the accuracy of the sampling timing, or aperture uncertainty of the sampler, frequently the analog-to-digital converter, must be appropriate for the frequencies being sampled 108MHz, not the lower sample rate.
- If the sampling theorem is interpreted as requiring twice the highest frequency, then the required sampling rate would be assumed to be greater than the Nyquist rate 216 MHz. While this does satisfy the last condition on the sampling rate, it is grossly oversampled.
- Note that if a band is sampled with n > 1, then a band-pass filter is required for the anti-aliasing filter, instead of a lowpass filter.
 ,
,and the reconstructive interpolation function, or lowpass filter impulse response, is
 .
.To accommodate undersampling, the bandpass condition is that X(f) = 0 outside the union of open positive and negative frequency bands
-
 for some positive integer
  .
.
- which includes the normal baseband condition as case n = 1 (except that where the intervals come together at 0 frequency, they can be closed).
The corresponding interpolation function is the bandpass filter given by this difference of lowpass impulse responses:
-
 .
.
Further generalizations of undersampling for the case of signals with multiple bands are possible, and signals over multidimensional domains (space or space-time) and have been worked out in detail by Igor Kluvánek.

Spectrum of the FM radio band (88–108 MHz) and its baseband alias under 44 MHz (n = 5) sampling. An anti-alias filter quite tight to the FM radio band is required, and there's not room for stations at nearby expansion channels such as 87.9 without aliasing. 補充說明2:
Spectrum of the FM radio band (88–108 MHz) and its baseband alias under 56 MHz (n = 4) sampling, showing plenty of room for bandpass anti-aliasing filter transition bands. The baseband image is frequency-reversed in this case (even n).
aliasing frequency:
混疊(aliasing),在訊號頻譜上可稱作疊頻;在影像上可稱作疊影,主要來自於對連續時間訊號作取樣以數位化時,取樣頻率低於兩倍奈奎斯特頻率。
在統計、訊號處理和相關領域中,混疊是指取樣訊號被還原成連續訊號時產生彼此交疊而失真的現象。當混疊發生時,原始訊號無法從取樣訊號還原。而混疊可能發生在時域上,稱做時間混疊,或是發生在頻域上,被稱作空間混疊。
在視覺影像的類比-數位轉換或音樂訊號領域,混疊都是相當重要的議題。因為在做類比-數位轉換時若取樣頻率選取不當將造成高頻訊號和低頻訊號混疊在一起,因此無法完美地重建出原始的訊號。為了避免此情形發生,取樣前必須先做濾波的動作。

兩個不同的正弦波卻有相同的樣本值。藍色正弦波的頻率 較低;紅色正弦波的頻率
 較高。
較高。週期現象上的混疊
太陽在天空由東往西移動,兩次的日出間隔了24小時。若某個人每23小時對天空拍張照片,太陽會好似由西向東移動,並且日出週期由24小時轉變成552小時(24×23=552)。相同的現象也會發生在高速旋轉的車輪鋼圈,視覺上看到的旋轉方向和實際上相反。這就是時間混疊。
若對一個穿有人字呢圖案外衣的人攝影,播放時會發現影片中的線條數目會少於真實圖案的線條數目,此現象被稱為摩爾紋。這就是空間混疊的例子,它的成因之後會闡明。
Aliasing and a sampled cosine signal
One challenge of teaching Fourier transform concepts is that each concept can be (and is) interpreted and explained in many different ways. It isn't always obvious how the different explanations for the same concepts are connected.
For example, in my last Fourier transform post I talked about aliasing. I said that if you sample a continuous-time cosine at a sampling frequency , then you can't distinguish between a cosine with frequency
  and a cosine with frequency
  .
.
In response, Dave S. wanted to know how this related to what he learned about aliasing: that aliasing is a "problem that occurs when the sampling rate of your discrete signal is not at least twice the [...] highest existing frequency [in the continuous-time signal]."
I know I promised to introduce the discrete Fourier transform next, but I'd like to change my mind and try to answer Dave's question instead. There are two key pieces of the question to address: What is the nature of the "problem," and what is the significance of "twice the highest frequency"?
I thought about drawing some new frequency-domain diagrams showing overlapping triangles like you'd see in Oppenheim and Schafer, but then I thought it might be better to just continue the sampled cosine example from last time.
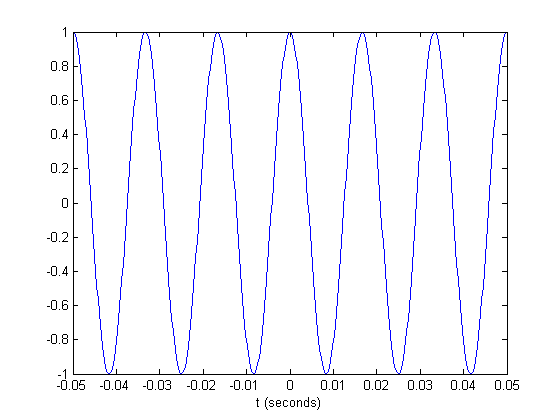
Let's start with a continuous-time cosine signal at 60 Hz.
f = 60;  % Hz
tmin = -0.05;
tmax = 0.05;
t = linspace(tmin, tmax, 400);
x_c = cos(2*pi*f * t);
plot(t,x_c)
xlabel('t (seconds)')
Let's sample with a sampling frequency of 800 Hz.
T = 1/800;
nmin = ceil(tmin / T);
nmax = floor(tmax / T);
n = nmin:nmax;
x1 = cos(2*pi*f * n*T);
hold on
plot(n*T,x1,'.')
hold off
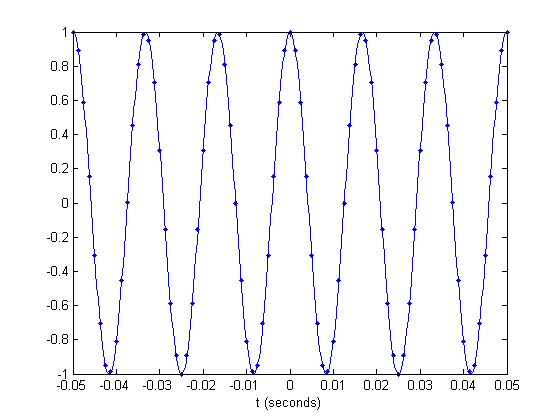
The sampling frequency of 800 Hz is well above 120 Hz, which is twice the frequency of the cosine. And you can see that the samples are clearly capturing the oscillation of the continuous-time cosine.
Let's try a lower sampling frequency.
T = 1/400;
nmin = ceil(tmin / T);
nmax = floor(tmax / T);
n = nmin:nmax;
x1 = cos(2*pi*f * n*T);
plot(t, x_c)
hold on
plot(n*T, x1, '.')
hold off
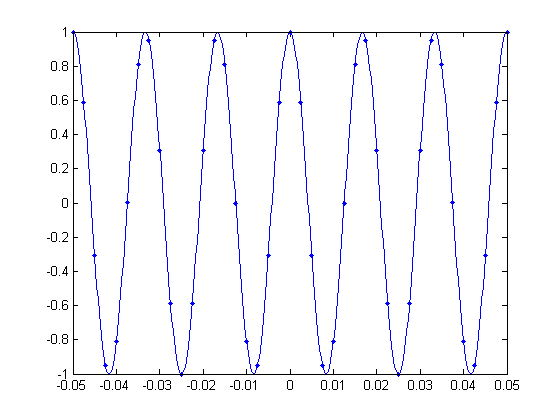
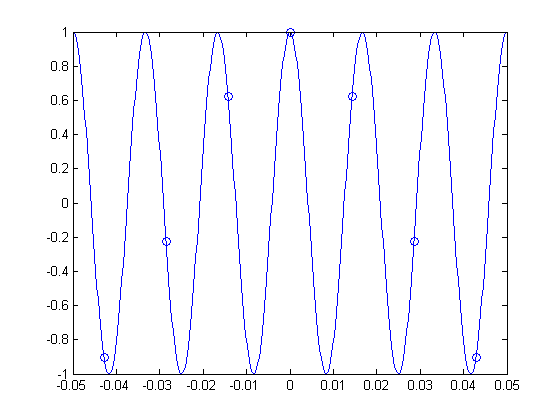
The samples above are still adequately capturing the shape of the cosine. Now let's drop the sampling frequency down to exactly 120 Hz, twice the frequency of the 60 Hz cosine. (And I'll switch to using circle markers to make the samples easier to see.)
T = 1/120;
nmin = ceil(tmin / T);
nmax = floor(tmax / T);
n = nmin:nmax;
x1 = cos(2*pi*f * n*T);
plot(t, x_c)
hold on
plot(n*T, x1, 'o')
hold off
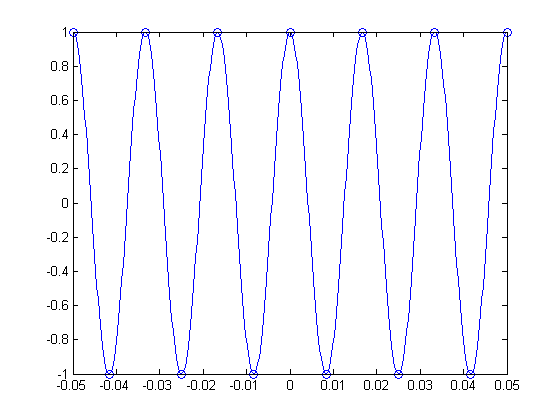
See how the samples jump back and forth between 1 and -1? And how they capture only the extremes of each period of the cosine oscillation? This is the significance of "twice the highest frequency of the signal" value for sampling frequency. If you'll allow a "hand-wavy" explanation here, I'll say that this sampling frequency of 120 Hz is just enough to capture the cosine oscillation.
But aliasing is worse that "just" losing information. When we drop the sampling frequency too low, the samples start to look increasingly like they came from a different, lower-frequency signal.
Let's try 70 Hz.
T = 1/70;
nmin = ceil(tmin / T);
nmax = floor(tmax / T);
n = nmin:nmax;
x1 = cos(2*pi*f * n*T);
plot(t, x_c)
hold on
plot(n*T, x1, 'o')
hold off
The samples above look like they actually could have come from a 10 Hz cosine signal, instead of a 60 Hz cosine signal. Take a look:
T = 1/70;
x_c = cos(2*pi*10 * t);
nmin = ceil(tmin / T);
nmax = floor(tmax / T);
n = nmin:nmax;
x1 = cos(2*pi*f * n*T);
plot(t, x_c)
hold on
plot(n*T, x1, 'o')
hold off
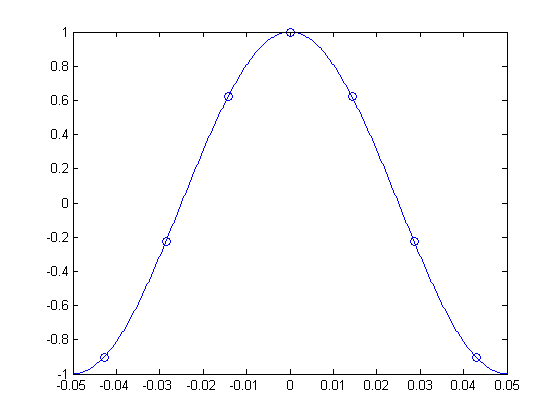
That's the heart of the "problem" of aliasing. Because the sampling frequency was too low, a high-frequency cosine looked like a low-frequency cosine after we sampled it.
Later on in this series I plan to come back again to the concept of aliasing and show some examples of how it looks in an image.
OK, now I'll start working on the upcoming discrete Fourier transform (DFT) post.
-
http://ocw.mit.edu/ans7870/18/18.06/javademo/Aliasing/


沒有留言:
張貼留言
注意:只有此網誌的成員可以留言。